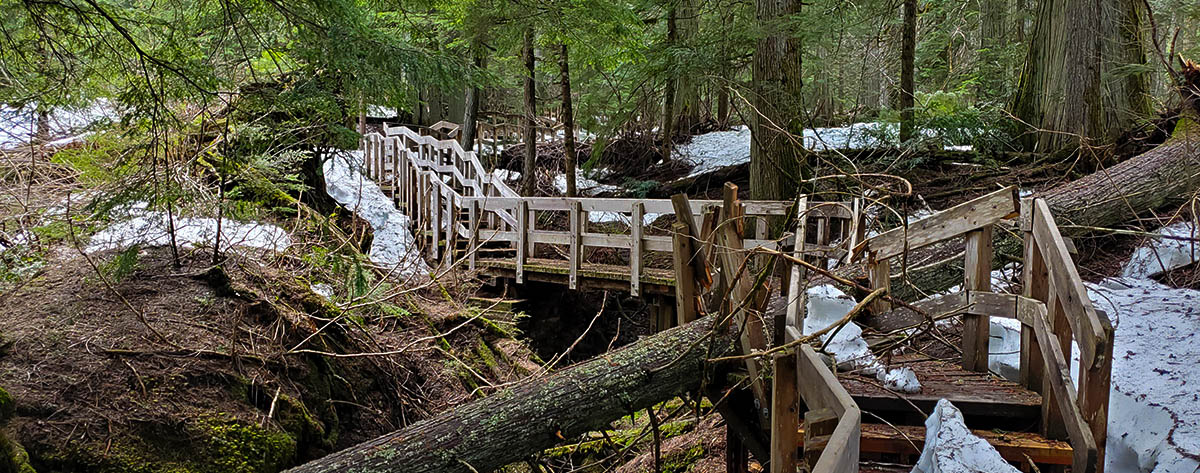
Sub-alpine and alpine, Mount Revelstoke National Park.
Climate Summary
Mount Revelstoke National Park
About Mount Revelstoke National Park
Mount Revelstoke National Park, located in the interior wet belt of southeastern British Columbia, protects 260 km² of the Columbia Mountains Natural Region. Characterized by large amounts of rain and snow, the park features a portion of the world’s only inland temperate cedar/hemlock rainforest, subalpine meadows bursting with wildflowers in summer, and high alpine lakes. Along with Glacier National Park, these parks represent 70% of the typical plant and animal life, and habitat found within the greater Columbia Mountains region.
Changes in Temperature
Mount Revelstoke National Park, much like the rest of Canada, is warming faster than the global average. If greenhouse emissions continue to increase at the current rate, then by 2051-2080 the average annual temperature in the park is projected to increase by about 4 °C relative to the recent past. The effects of a warming climate include hotter maximum temperatures, warmer minimum temperatures, and fewer days below zero per year. A warmer climate will also likely intensify some weather extremes, increasing the severity of heatwaves, droughts, and wildfires.
Changes in Precipitation and Water Availability
Within Mount Revelstoke National Park, total annual precipitation is expected to increase. Models also project an increase in precipitation extremes (e.g. heavy precipitation events) over that same time period. For example, the maximum amount of rainfall over a 5-day period is expected to increase by 16% under a high-emission scenario, relative to the recent past. Seasonal changes in temperature and precipitation will likely combine to affect glaciers, stream flows, and lake levels. For example, rising winter temperatures can cause more rain instead of snow and change when rivers reach their highest flow in the spring.
| Variable | Recent Past1 - 1961 to 1990 | Moderate Emission FutureFootnote 2 - 2051 to 2080 |
High Emission FutureFootnote 2 - 2051 to 2080 |
|---|---|---|---|
| Mean Annual Temperature |
2.2°C |
5.2°C |
6.4°C |
| Hottest day 3 |
28.3°C |
32.3°C |
34.2°C |
| Coldest day4 |
-28.8°C |
-24.6°C |
-22.4°C |
| Growing degree days (5°C)5 |
906 |
1464 |
1709 |
| Frost-free season (days)6 |
102 |
155 |
174 |
| Total annual precipitation |
1209 mm |
1298 mm |
1334 mm |
| Wet days (>20 mm) |
6 |
8 |
9 |
| Max. 5-day precipitation |
80 mm |
90 mm |
95 mm |
Footnotes
Spotlight on Impacts: Birds & Climate Change

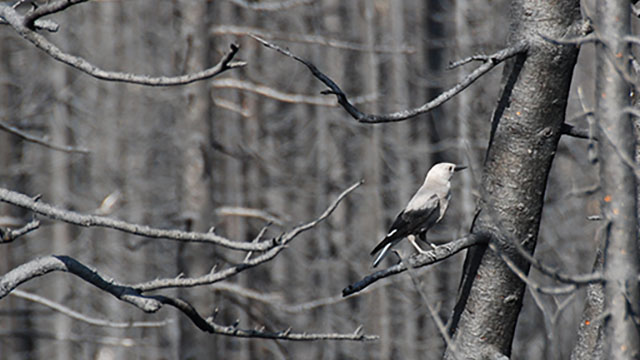
Parks Canada collaborated on a study to better understand how birds may be affected by climate change. Results suggest that under a high emission scenario, 17% of summer and 15% of winter bird assemblages could be completely different in Mount Revelstoke National Park by 2050. For example, Clark’s nutcracker (Nucifraga columbiana) could be extirpated from the Park by mid-century, impacting the survival of the endangered whitebark pine (Pinus albicaulis), as Clark’s nutcrackers are integral to whitebark pine seed dispersal.

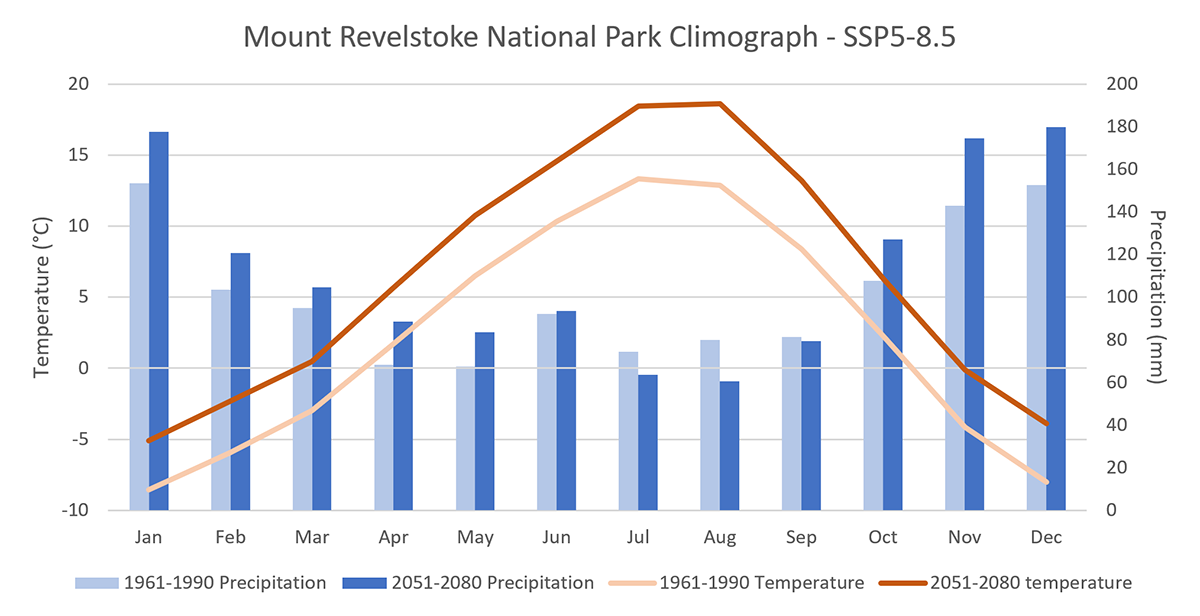
Note: This graph only shows the median value of the ensemble and does not display the range of individual model projections.
Climograph of projected monthly temperature and precipitation values - SSP5-8.5 - Text version
| Month | 1961-1990 | 2051-2080 |
|---|---|---|
| January | -8.6 | -5.1 |
| February | -5.9 | -2.3 |
| March | -3 | 0.5 |
| April | 1.7 | 5.7 |
| May | 6.5 | 10.8 |
| June | 10.3 | 14.6 |
| July | 13.3 | 18.5 |
| August | 12.9 | 18.6 |
| September | 8.4 | 13.2 |
| October | 2.3 | 6.3 |
| November | -4.2 | 0.1 |
| December | -8 | -3.9 |
| Month | 1961-1990 | 2051-2080 |
|---|---|---|
| January | 154 | 178 |
| February | 104 | 121 |
| March | 95 | 105 |
| April | 68 | 89 |
| May | 68 | 84 |
| June | 92 | 94 |
| July | 74 | 63 |
| August | 80 | 61 |
| September | 81 | 79 |
| October | 108 | 127 |
| November | 143 | 175 |
| December | 153 | 180 |
Potential Climate Change Impacts and Adaptation Responses

Climate change will affect all programs under Parks Canada’s mandate. There are many likely impacts associated with projected future climate conditions at Mount Revelstoke National Park. The table below outlines some examples of these projected conditions and impacts, as well as potential options for adaptation responses. Parks Canada uses information like this, along with Indigenous knowledge, to better manage operations in national historic sites, national parks, and national marine conservation areas, and the services offered to visitors.
| Parks Canada Program Area | Future Climate Condition | Example of Likely Impact | Example of Potential Adaptation Response |
|---|---|---|---|
| Natural heritage | Warmer temperatures | Species range shifts |
Collaborate with neighbouring land managers to maintain or restore connectivity and facilitate species movement. |
| Cultural heritage | More frequent and intense rain storms |
Increased flooding and erosion risk |
Work with Indigenous partners to incorporate impacts to cultural landscapes into flood |
| Visitor experience |
Shifting seasons |
Extended summer and shoulder seasons |
Assess changes in use patterns and demographics, and identify expected shifts in visitor activity supply and demand. |
| Health, safety & wellness |
More heat waves |
Increased wildfire risk |
Provide access to indoor cleaner air spaces for people who require respite from wildfire smoke conditions. |
| Built assets |
More winter precipitation |
Increased snow loads |
Plan building maintenance practices to reduce snow overloading risks related to increasing accumulated snow weights. |
Working Together
The Canadian Centre for Climate Services (CCCS) provides access to data and information as well as offers training and support on how to use climate information to support decisions that increase resilience to the impacts of climate change. Parks Canada works with CCCS to develop site-specific climate change summaries that inform and support adaptation planning at Parks Canada-administered places. Contact the Parks Canada climate change research team.
About the data
As per standard practice, the data in this report comes from an ensemble of 26 CMIP6 global climate models that have been downscaled to 10 km by 6 km using the BCCAQv2 method. Values have been spatially averaged across the park and temporally averaged over two 30-year time periods (1961-1990 and 2051-2080). The first summary table displays the median, 10th and 90th percentile values of the climate model ensemble, which helps demonstrate the range in model projections. For a full description of the data and modeling methodology, and to download additional data, visit the Climate Data for a Resilient Canada website.
Looking Toward the Future
The amount of future warming we experience depends on the concentration of greenhouse gases in the atmosphere. To account for future emissions uncertainty, climate models are run using different scenarios, called Shared Socioeconomic Pathways (SSPs). SSP1-2.6 is a low emission scenario characterized by rapid emissions reductions and policy focused on sustainable development. In this scenario, emissions peak around 2020 and decline to zero near mid-century. In the moderate SSP2-4.5 scenario, socioeconomic development continues to follow current patterns and emissions peak around 2050 then decline. SSP5-8.5 represents a very high emission scenario characterized by further fossil-fuel driven economic development. In this scenario, emissions rise throughout the century.
Related links
- Date modified :