
Climate summary
Prince Edward Island National Park
Prince Edward Island National Park and Green Gables Heritage Place.
- About Prince Edward Island National Park
- Changes in temperature
- Changes in precipitation and water availability
- Projected climate values for Prince Edward Island National Park
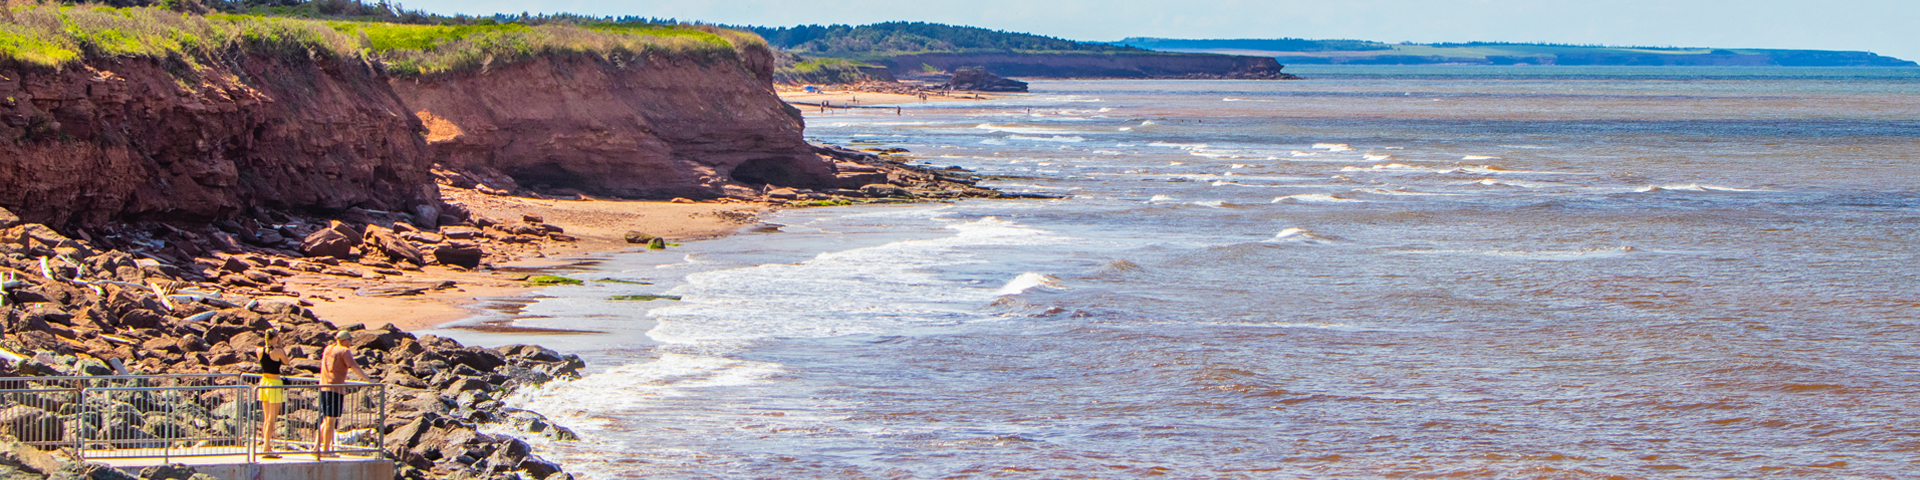
- Spotlight on impacts: Coastal erosion and climate change
- Looking toward the future
- About the data
- Potential climate change impacts and adaptation responses
- Working together
Elev. range: 0 to 61 m Prince Edward Island National Park, located on the north side of Prince Edward Island protects 37.6 km2 of the Maritime Plain Natural Region. The lands and waters are within the traditional territory of the Mi’kmaq First Nations and are places of ecological, cultural and historical significance. As one of Canada’s premier beach destinations, the park contains sandy beaches, sandspits, barrier islands, and shifting sand dunes as well as Wabanaki-Acadian forest, hardwood forests, and black spruce bogs. The coastal ecosystem supports numerous Species at Risk including critical habitat for Piping Plover and Gulf of St. Lawrence Aster, and proposed Bank Swallow critical habitat, and it is an important foraging and resting area for migratory birds. Green Gables Heritage Place, also part of L.M. Montgomery’s Cavendish National Historic Site, is a top heritage, cultural, and tourist attraction within the national park.About Prince Edward Island National Park
Area: 37.6 km2
Latitude: 46.4°N
Longitude: 63.2°W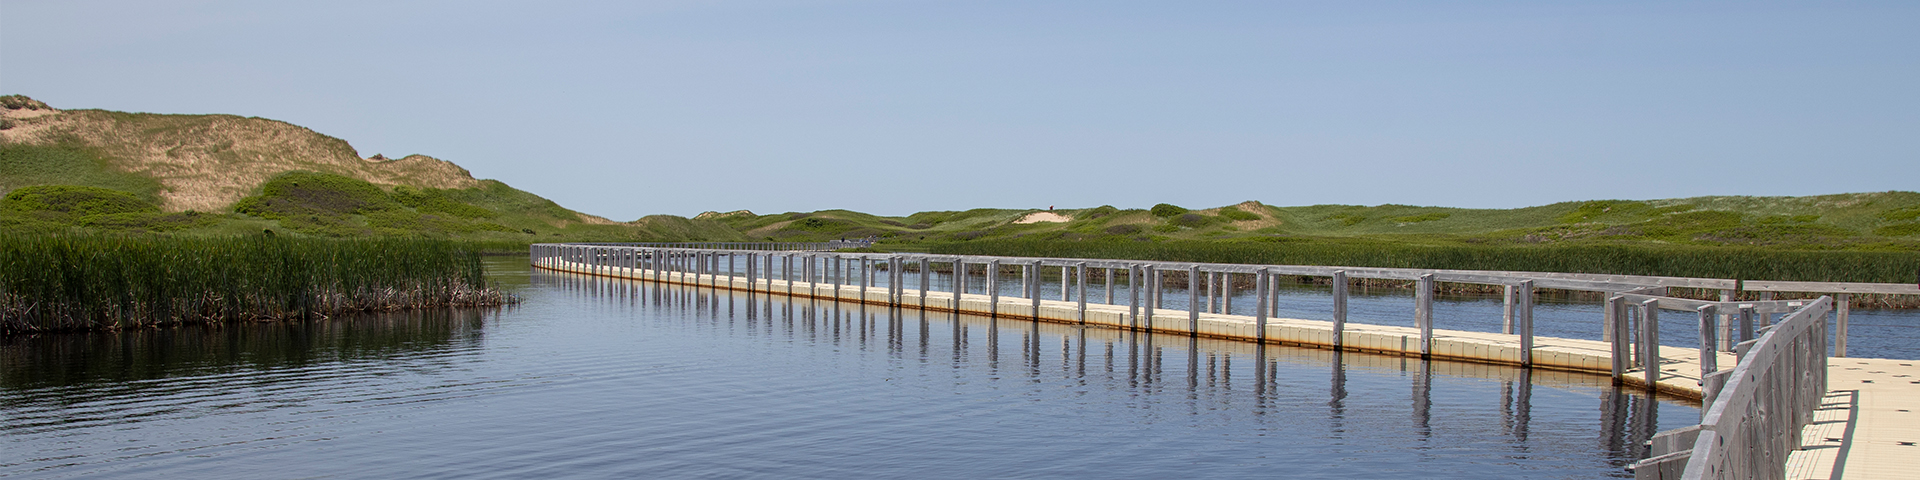 Floating boardwalk, Greenwich
Changes in temperature
Prince Edward Island National Park, much like the rest of Canada, is warming faster than the global average. If emissions continue to increase at the current rate, then by 2051–2080 the average annual temperature in the park is projected to increase by about 3 to 5 degrees relative to the recent past. The effects of a warming climate include hotter maximum temperatures, warmer minimum temperatures, and fewer days below zero per year. A warmer climate will likely intensify some weather extremes, increasing the severity of heatwaves, droughts and wildfires. Rising temperatures are also a major contributor to sea level rise. Under a high emission scenario, relative sea level is projected to increase by about 47 cm by 2070 in Prince Edward Island National Park.
Changes in precipitation and water availability
Within Prince Edward Island National Park, total annual precipitation is projected to increase. Models also project an increase in precipitation extremes (e.g. heavy precipitation events) over that same time period. For example, the maximum amount of rainfall over a 1-day period is expected to increase by 18% under a high emission scenario, relative to the recent past. Seasonal changes in temperature and precipitation will likely combine to affect snow and ice cover, stream flows, and coastal erosion. For example, rising winter temperatures can cause more precipitation to fall as rain rather than snow leading to increases in runoff and erosion rates.
 Dalvay Beach
Projected climate values for Prince Edward Island National Park
| Variable | Recent PastFootnote 1 1961 to 1990 |
Moderate Emission FutureFootnote 2 - 2051 to 2080 |
High Emission FutureFootnote 2 -
2051 to 2080 |
|---|---|---|---|
| Average annual temperature | 5.5°C (5.3 – 5.7) |
9.4 (8.1– 10.3) |
10.4°C (9.3 – 11.7) |
| Days above 29°C | 2 (1 – 2) |
16 (10 – 30) |
28 (17 – 45) |
| Frost-free season (days)Footnote 3 | 166 (163 – 170) |
206 (192 – 225) |
218 (208 – 242) |
| Growing degree daysFootnote 4 | 1645 (1599 – 1688) |
2341 (2128 – 2622) |
2642 (2358 – 2928) |
| Total annual precipitation | 1067 mm (1043 – 1087) |
1161 mm (1089 – 1230) |
1178 mm (1095 – 1254) |
| Maximum 1-day precipitation | 43 (42 - 45) |
52 (47 - 56) |
54 (49 - 60) |
| Periods with 5 or more consecutive dry days | 9 (9 - 10) |
9 (8 – 10) |
9 (9 – 10) |
| Freeze-thaw cyclesFootnote 5 | 69 (68 – 71) |
58 (50 – 61) |
55 (43 – 65) |
Larger values denote the median of an ensemble of 27 climate models; values in brackets denote the 10th and 90th percentile values.
Footnotes
Across Prince Edward Island National Park, climate change impacts are accelerating the rate of coastal erosion. A growing proportion of the total amount of coastal erosion that is observed at Prince Edward Island National Park is driven by increasingly frequent and severe storm surges, a reduction in nearshore ice presence, and sea-level rise. Prince Edward Island Field Unit strives to build climate resilience in all operational decisions, including through the strategic, planned retreat of vulnerable built assets, and prioritization of safe, accessible visitor experiences.Spotlight on impacts: Coastal erosion and climate change
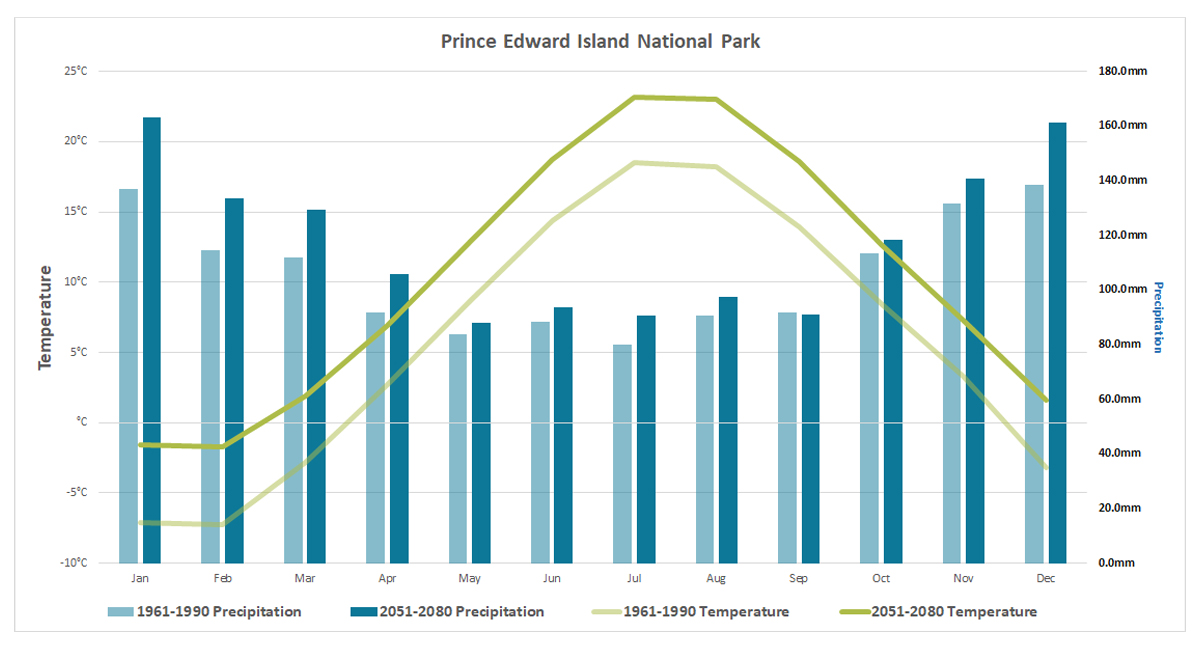
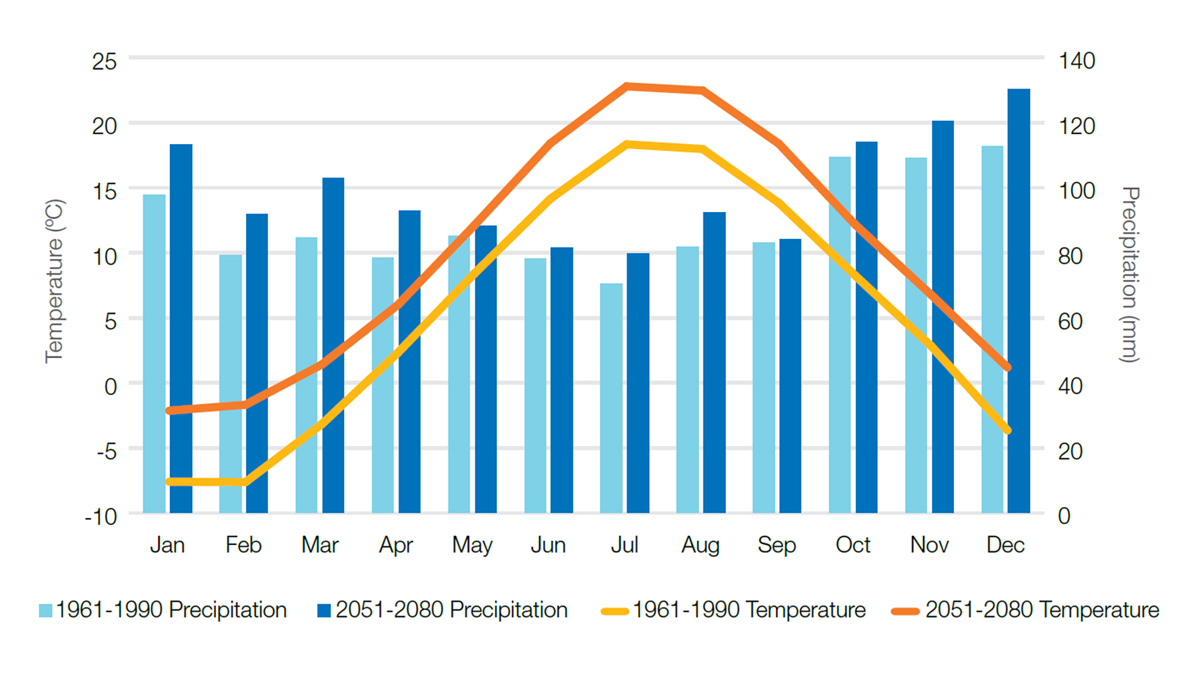
Climograph
Climograph showing projected monthly temperature and precipitation values for the past (1961-1990) and future high emission scenario (SSP5-8.5; 2051-2080). Values represent the mean of a 27 climate model ensemble averaged across Fundy National Park. Note: This graph only shows the mean value of the ensemble and does not display the range of individual model projections.
Climograph showing projected monthly temperature and precipitation values. Text version.
| Month | 1961-1990 | 2051-2080 |
|---|---|---|
| January | 136.9 | 163 |
| February | 114.4 | 133.4 |
| March | 111.7 | 129.2 |
| April | 91.6 | 105.9 |
| May | 83.9 | 87.8 |
| June | 88.4 | 93.5 |
| July | 80 | 90.7 |
| August | 90.7 | 97.4 |
| September | 91.7 | 91.1 |
| October | 113.4 | 118.4 |
| November | 131.6 | 140.8 |
| December | 138.6 | 161.3 |
| Month | 1961-1990 | 2051-2080 |
|---|---|---|
| January | -7.1 |
-1.6 |
| February | -7.3 | -1.7 |
| March | -2.8 | 1.9 |
| April | 2.7 | 6.9 |
| May | 8.6 | 12.8 |
| June | 14.4 | 18.7 |
| July | 18.5 | 23.2 |
| August | 18.2 | 23 |
| September | 13.9 | 18.6 |
| October | 8.45 | 12.7 |
| November | 3.3 | 7.3 |
| Décember | -3.2 | 1.6 |
Looking toward the future

The amount of future warming we experience depends on the concentration of greenhouse gases in the atmosphere. To account for future emissions uncertainty, climate models are run using different scenarios, called Shared Socioeconomic Pathways (SSPs). SSP1-2.6 is a low emission scenario characterized by rapid emissions reductions and policy focused on sustainable development. In this scenario, emissions peaked around 2020 and decline to zero near mid-century. In the moderate SSP2-4.5 scenario, socioeconomic development continues to follow current patterns and emissions peak around 2050 then decline. SSP5-8.5 represents a very high emission scenario characterized by further fossil-fuel driven economic development. In this scenario, emissions rise throughout the century.
About the data
As per standard practice, the data in this report comes from an ensemble of 27 CMIP6 global climate models that have been downscaled to 6 km by 10 km using the BCCAQv2 method. Values have been spatially averaged across the park and temporally averaged over two 30-year time periods (1961-1990 and 2051-2080). The summary table above displays the median, 10th, and 90th percentile values of the climate model ensemble, which helps demonstrate the range in model projections. For a full description of the data and modelling methodology, and to download additional data, visit ClimateData.ca.
Potential climate change impacts and adaptation responses
Climate change will affect all programs under Parks Canada’s mandate. There are many likely impacts associated with projected future climate conditions at Prince Edward Island National Park. The table below outlines some examples of these projected conditions and impacts, as well as potential options for adaptation responses. Parks Canada works with Indigenous partners to develop and implement climate change adaptation responses. Parks Canada uses information like this, along with Indigenous knowledge, to better manage operations in national historic sites, national parks, and national marine conservation areas, and the services offered to visitors.
| Parks Canada program area | Future climate condition | Example of likely impact | Example of potential adaptation response |
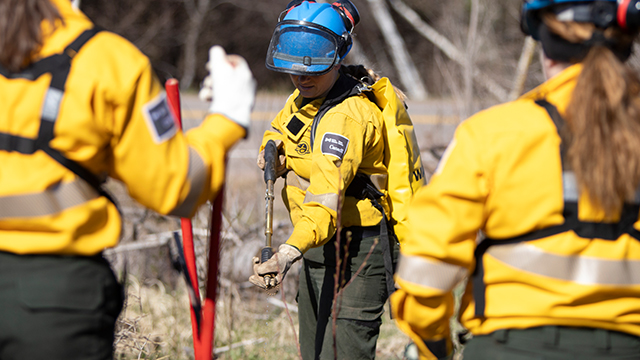
| Natural heritage | Warmer temperatures | Species range shift | Apply climate-smart forest restoration practices by considering the future climate suitability of species selected for tree planting. |
| Cultural heritage | More extreme weather events | Increased coastal erosion risk | After major storm events, collaborate with Indigenous partners to document and preserve any exposed culturally significant items. |
| Visitor experience | Warmer temperatures | Increased visitation rates and extended visitor season |
Increase number of compliance staff on duty to support management and resource protection. |
| Health, safety & wellness | More extreme heat events | Increased risk of heat exhaustion for staff | Create flexible staff schedules to defer outdoor work during high heat periods and establish more frequent check-ins during periods of extreme heat. |
| Built assets | Increased frequency and severity of extreme weather events |
Higher storm surge | Plan for coastal retreat and design climate-smart coastal infrastructure such as moveable structures and retractable beach accesses. |
Working together
The Canadian Centre for Climate Services (CCCS) provides access to data and information as well as offers training and support on how to use climate information to support decisions that increase resilience to the impacts of climate change. Parks Canada works with CCCS to develop site-specific climate change summaries that inform and support adaptation planning at Parks Canada-administered places.
Canada.ca/climate-services | changementclimatique-climatechange@pc.gc.ca
Disclaimer: His Majesty the King in right of Canada as represented by the Minister of Environment and Climate Change does not warrant or guarantee the accuracy or completeness of the information (“Data”) on this resource and do not assume any responsibility or liability with respect to any damage or loss arising from the use or interpretation of the Data.
*Information to be updated in 2025.